
Innovex International, Inc. (NYSE: INVX) (“Innovex,” the “Company” or “we”) today announced financial and operating results for the second quarter of 2026.
This press release features multimedia. View the full release here: https://www.businesswire.com/news/home/20260803958068/en/
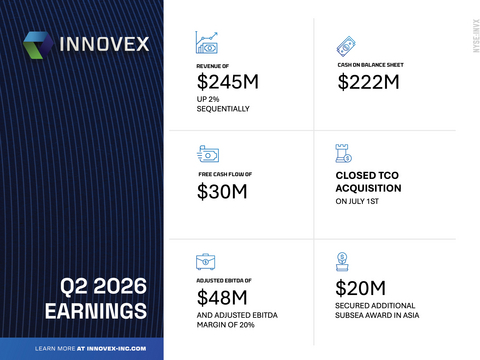
Innovex delivered an excellent second quarter – with revenue at the high end of the guidance range and strong operational execution across the business.
Second Quarter Highlights
- Revenue of $245 million, up 2% quarter-over-quarter and up 9% year-over-year
- Net Income of $25 million and Net Income Margin of 10%
- Adjusted EBITDA1 of $48 million and Adjusted EBITDA Margin1 of 20%
- Net Cash Provided by Operating Activities of $37 million
- Free Cash Flow1 of $30 million
- Income from Operations of $100 million (twelve months ended June 30, 2026)
- Return on Capital Employed1 of 12% (twelve months ended June 30, 2026)
- $222 million of cash and cash equivalents and no bank debt at quarter-end
- Awarded an additional $20 million subsea tension riser package for an operator in Malaysia, with follow-on wellhead awards anticipated
- Completed the first successful XPak trial with a major independent oil company in Asia
- Closed the acquisition of TCO Group AS (“TCO”) in a cash and stock transaction valued at $95 million on July 1, 2026
|
(1) |
Adjusted EBITDA, Adjusted EBITDA Margin, Free Cash Flow and Return on Capital Employed (“ROCE”) are non-GAAP measures. Reconciliations of Adjusted EBITDA to net income, Free Cash Flow to net cash provided by operating activities, and ROCE to income from operations, the most directly comparable financial measures presented in accordance with GAAP, are outlined in the reconciliation tables accompanying this release. |
Adam Anderson, CEO, commented, “We delivered an excellent second quarter – with revenue at the high end of our guidance range and strong operational execution across the business. Performance was supported by improving activity in key international markets and growing commercial momentum within our subsea business. Our ‘No Barriers’ culture has unleashed our subsea teams – as evidenced by a $20 million subsea award in Malaysia, the first successful XPak trial for a major operator in Asia Pacific, and the first installation of our ArgoLATCH Subsea Release Plug in a key deepwater exploration well in Brazil – an innovation that combines technologies from both legacy Innovex and legacy Dril-Quip. Improving end-market fundamentals, innovation, and strong execution are expected to continue supporting momentum in our subsea business results over the coming quarters. Our Canadian wellhead team also completed its first surface wellhead delivery to Mexico during the quarter, leveraging Innovex’s international platform to expand into a new market. These results reflect the strength of our differentiated technology portfolio and the benefits of our customer-focused culture. On July 1st, we completed the acquisition of TCO, a highly complementary, capital-light business that expands our technology offering, strengthens our international presence, and exemplifies our disciplined ‘big impact, small ticket’ acquisition strategy.”
Kendal Reed, CFO, continued, “Our second quarter results demonstrate the strength of Innovex’s capital-light business model. We generated $30 million of Free Cash Flow and ended the quarter with $222 million of cash and cash equivalents and no bank debt, providing significant financial flexibility to invest in high-return capital allocation opportunities. We are very pleased with the completion of the TCO acquisition for $95 million, funded with a mix of cash and equity, which preserves our strong balance sheet and financial capacity to pursue our robust pipeline of M&A opportunities. TCO is an excellent example of our stringent quantitative and qualitative M&A framework in action. TCO is a high-margin, cash-generative business with a portfolio of largely consumable products that fit our ‘big impact, small ticket’ business proposition. In addition to acquiring TCO at an attractive valuation, we see meaningful opportunities to accelerate its organic growth by leveraging the Innovex platform. The transaction enhances Innovex’s corporate margin profile and is expected to be accretive to Innovex’s earnings per share.”
|
Financial Summary |
||||||||||||
|
|
|
Three months ended |
|
|||||||||
|
(in thousands) |
|
June 30, |
|
March 31, |
|
June 30, |
||||||
|
Revenue |
|
$ |
244,896 |
|
|
$ |
239,031 |
|
|
$ |
224,234 |
|
|
Net income (loss) |
|
|
25,031 |
|
|
|
(16,671 |
) |
|
|
15,345 |
|
|
Net income (loss) % revenue |
|
|
10 |
% |
|
|
(7 |
)% |
|
|
7 |
% |
|
Adjusted EBITDA (1) |
|
|
47,997 |
|
|
|
49,286 |
|
|
|
46,642 |
|
|
Adjusted EBITDA Margin (1) |
|
|
20 |
% |
|
|
21 |
% |
|
|
21 |
% |
|
Net cash provided by operating activities |
|
|
37,028 |
|
|
|
19,840 |
|
|
|
59,210 |
|
|
Free Cash Flow (1) |
|
|
30,387 |
|
|
|
14,013 |
|
|
|
51,913 |
|
|
Income (loss) from operations |
|
|
33,782 |
|
|
|
(21,832 |
) |
|
|
22,695 |
|
|
|
|
Twelve Months Ended |
|
|||||||||
|
|
|
June 30, |
|
December 31, |
|
June 30, |
||||||
|
ROCE (1) |
|
|
12 |
% |
|
|
10 |
% |
|
|
13 |
% |
|
(1) |
Adjusted EBITDA, Adjusted EBITDA Margin, Free Cash Flow and Return on Capital Employed (“ROCE”) are non-GAAP financial measures. See definition of these measures and the reconciliation of GAAP to non-GAAP financial measures in the Supplemental Information tables below. |
Operational & Financial Results
Kendal Reed, CFO, commented, “Operational execution remained strong throughout the second quarter as we continued to improve the efficiency and competitiveness of the business while delivering revenue at the high end of our guidance range. Our business in the Middle East improved relative to the first quarter and Mexico benefited from increased customer activity and continued demand for our differentiated completion technologies. Across our subsea businesses, we continued to build commercial momentum through new technology deployments, increased customer engagement and improved operational execution. While geopolitical uncertainty and project timing may continue to create quarter-to-quarter variability, we believe the underlying trajectory of the business remains positive as we enter the second half of 2026.”
Adam Anderson, CEO, concluded, “We are encouraged by the momentum across our platform of businesses. Activity across Latin America, particularly in Mexico, continues to improve. We are also seeing encouraging commercial progress in both the Middle East and Asia Pacific, including market share gains in expandable liner hanger technologies, growth in unconventional applications in Saudi Arabia, and the deployment of our technologies into new fields. I am particularly excited by the outlook for our subsea business, where improving offshore market fundamentals are complemented by our stronger competitive position, differentiated technologies, alliance with OneSubsea, and customer-focused commercial execution. Over the past several months, we have secured a number of meaningful project awards and expanded our presence with new customers and in new regions, providing us with growing confidence in the long-term trajectory of the business. Looking ahead, we are also excited about the opportunities created by the addition of TCO, whose differentiated technologies further strengthen our ability to deliver value for customers around the world.
More broadly, we believe Innovex is entering a new phase. We now have a stronger, more efficient operating platform, a broader portfolio of differentiated technologies, and greater opportunities to extend those technologies across customers, applications, and geographies. We remain focused on converting these advantages into sustainable, profitable growth while maintaining our discipline around execution and capital allocation.”
Balance Sheet, Debt, Cash Flow & Other
Net cash provided by operating activities was $37 million for the second quarter of 2026, while capital expenditures totaled $7 million (approximately 2.7% of revenue) for the second quarter of 2026.
Innovex generated Free Cash Flow of $30 million during the second quarter of 2026 and ended the quarter with approximately $222 million of cash and cash equivalents and no bank debt.
Innovex maintains a strong liquidity position and disciplined balance sheet to preserve flexibility and support high-return capital allocation opportunities. We continue to focus on M&A opportunities with strong quantitative and qualitative characteristics.
Return on Capital Employed (“ROCE”)
Innovex’s efficient capital allocation and capital-light business model enable the Company to generate strong returns on its invested capital. Income from operations for the twelve months ended June 30, 2026 was $100 million. Return on Capital Employed (“ROCE”) for the twelve months ended June 30, 2026 was 12%. We remain focused on capital efficiency, which we believe is a key driver of sustainable value creation for our stockholders.
Q3 2026 Guidance
Looking to the third quarter of 2026, Innovex expects to generate $260 – $270 million in total revenue and Adjusted EBITDA of $51 – $57 million. Q3 guidance includes TCO contributions.
The Company is unable to provide a reconciliation of Adjusted EBITDA guidance to the most directly comparable
GAAP measure without unreasonable effort due to the inherent difficulty in forecasting the timing and magnitude of
items that have not yet occurred.
Conference Call Details
Management will host a conference call and a webcast to discuss the financial results on August 4, 2026, at 9:00 a.m. Eastern Time / 8:00 a.m. Central Time. The call will be open to all interested parties and may include forward-looking statements. To access the call, please dial in approximately ten minutes prior to the start time.
Date / Time: August 4, 2026 – 9:00 a.m. Eastern Time / 8:00 a.m. Central Time
Webcast: https://events.q4inc.com/attendee/159948172
U.S. Toll-Free Dial-In: +1 (833) 461-5787
U.S. Local Dial-In: +1 (585) 542-9983
Meeting ID: 159948172
A replay of the webcast will be made available shortly after the call and may be accessed through the Investors section of the Company’s website.
About Innovex International, Inc.
Innovex International, Inc. (NYSE: INVX) is a Houston-based company established in 2024 following the merger of Dril-Quip, Inc. and Innovex Downhole Solutions, Inc.
Innovex’s comprehensive portfolio extends throughout the lifecycle of the well, and innovative product integration ensures seamless transitions from one well phase to the next, driving efficiency, lowering costs, and reducing the rig site service footprint for the customer.
With locations throughout North America, Latin America, Europe, the Middle East, and Asia, no matter where you need us, our team is readily available with technical expertise, conventional and innovative technologies, and ever-present customer service.
Forward-Looking Statements
Certain statements contained in this press release and oral statements made regarding the matters addressed in this release constitute “forward-looking statements” within the meaning of the Private Securities Litigation Reform Act of 1995. These forward-looking statements are subject to risks, uncertainties and other factors, many of which are outside of Innovex’s control, that could cause actual results to differ materially from the results discussed in the forward-looking statements.
Forward-looking statements can be identified by the use of forward-looking terminology including “may,” “believe,” “expect,” “intend,” “anticipate,” “plan,” “should,” “estimate,” “continue,” “potential,” “will,” “hope” or other similar words and include the Company’s expectation of future performance contained herein. These statements discuss future expectations, contain projections of results of operations or of financial condition, or state other “forward-looking” information. You are cautioned not to place undue reliance on any forward-looking statements, which can be affected by assumptions used or by risks or uncertainties. Consequently, no forward-looking statements can be guaranteed. When considering these forward-looking statements, you should keep in mind the risks related to the Company’s merger and acquisition activities, including the ultimate outcome and results of integrating operations, the effects of the Company’s merger and acquisition activities (including the Company’s future financial condition, results of operations, strategy and plans), potential adverse reactions or changes to business relationships resulting from the completion of mergers and acquisitions, expected benefits from mergers and acquisitions and the ability of the Company to realize those benefits, the significant costs required to integrate operations, whether merger or acquisition-related litigation will occur and, if so, the results of any litigation, settlements and investigations, operating hazards, natural disasters, weather-related delays, casualty losses and other matters beyond our control; acts of terrorism, war or political or civil unrest in the United States or elsewhere; loss or corruption of our information or a cyberattack on our computer systems; uncertainties pertaining to the Impulse litigation; the risks related to economic conditions and other factors noted in the Company’s Annual Report on Form 10-K, any Quarterly Reports on Form 10-Q and the other documents that the Company files with the Securities and Exchange Commission. The risk factors and other factors noted therein could cause actual results to differ materially from those contained in any forward-looking statement. Innovex disclaims any duty to update and does not intend to update any forward-looking statements, all of which are expressly qualified by the statements in this section, to reflect events or circumstances after the date of this press release, except as may be required by law.
|
Innovex International, Inc. |
||||||||||||
|
Condensed Consolidated Statements of Operations and Comprehensive Income |
||||||||||||
|
(Unaudited) |
||||||||||||
|
|
||||||||||||
|
|
|
Three months ended |
|
|||||||||
|
(in thousands, except share and per share amounts) |
|
June 30, |
|
March 31, |
|
June 30, |
||||||
|
Revenues |
|
$ |
244,896 |
|
|
$ |
239,031 |
|
|
$ |
224,234 |
|
|
Cost of revenues |
|
|
161,248 |
|
|
|
154,522 |
|
|
|
152,515 |
|
|
Selling, general and administrative expenses |
|
|
39,089 |
|
|
|
41,748 |
|
|
|
28,835 |
|
|
Gain on sale of assets, net |
|
|
(9,853 |
) |
|
|
(2,020 |
) |
|
|
(419 |
) |
|
Depreciation and amortization |
|
|
16,213 |
|
|
|
16,222 |
|
|
|
14,974 |
|
|
Impairment of long-lived assets |
|
|
— |
|
|
|
— |
|
|
|
503 |
|
|
Acquisition and integration costs |
|
|
1,613 |
|
|
|
1,588 |
|
|
|
5,131 |
|
|
Provision for legal settlement |
|
|
2,804 |
|
|
|
48,803 |
|
|
|
— |
|
|
Income (loss) from operations |
|
$ |
33,782 |
|
|
$ |
(21,832 |
) |
|
$ |
22,695 |
|
|
Interest (income) expense, net |
|
|
(653 |
) |
|
|
(388 |
) |
|
|
551 |
|
|
Other (income) expense, net |
|
|
(972 |
) |
|
|
150 |
|
|
|
(92 |
) |
|
Income (loss) before income taxes |
|
$ |
35,407 |
|
|
$ |
(21,594 |
) |
|
$ |
22,236 |
|
|
Income tax expense (benefit), net |
|
|
10,376 |
|
|
|
(4,923 |
) |
|
|
6,891 |
|
|
Net income (loss) |
|
$ |
25,031 |
|
|
$ |
(16,671 |
) |
|
$ |
15,345 |
|
|
|
|
|
|
|
|
|
|
|
|
|||
|
Earnings (loss) per common share |
|
|
|
|
|
|
|
|
|
|||
|
Basic |
|
$ |
0.36 |
|
|
$ |
(0.24 |
) |
|
$ |
0.22 |
|
|
Diluted |
|
$ |
0.36 |
|
|
$ |
(0.24 |
) |
|
$ |
0.22 |
|
|
|
|
|
|
|
|
|
|
|
|
|||
|
Weighted average common shares outstanding |
|
|
|
|
|
|
|
|
|
|||
|
Basic |
|
|
68,793,160 |
|
|
|
68,940,260 |
|
|
|
68,943,387 |
|
|
Diluted |
|
|
69,523,359 |
|
|
|
68,940,260 |
|
|
|
69,147,457 |
|
|
|
|
|
|
|
|
|
|
|
|
|||
|
Other comprehensive income (loss) |
|
|
|
|
|
|
|
|
|
|||
|
Net income (loss) |
|
$ |
25,031 |
|
|
$ |
(16,671 |
) |
|
$ |
15,345 |
|
|
Foreign currency translation adjustment |
|
|
(440 |
) |
|
|
1,750 |
|
|
|
6,728 |
|
|
Comprehensive income (loss) |
|
$ |
24,591 |
|
|
$ |
(14,921 |
) |
|
$ |
22,073 |
|
|
Innovex International, Inc. |
||||||||||||
|
Condensed Consolidated Balance Sheets |
||||||||||||
|
(Unaudited) |
||||||||||||
|
|
||||||||||||
|
(in thousands, except share and par value amounts) |
|
June 30, |
|
March 31, |
|
June 30, |
||||||
|
ASSETS |
|
|
|
|
|
|
|
|
|
|||
|
Current assets |
|
|
|
|
|
|
|
|
|
|||
|
Cash and cash equivalents |
|
$ |
222,055 |
|
|
$ |
200,707 |
|
|
$ |
68,781 |
|
|
Trade receivables, net |
|
|
240,094 |
|
|
|
245,633 |
|
|
|
220,966 |
|
|
Inventories, net |
|
|
264,837 |
|
|
|
252,987 |
|
|
|
278,495 |
|
|
Other current assets |
|
|
61,541 |
|
|
|
53,564 |
|
|
|
101,863 |
|
|
Total current assets |
|
|
788,527 |
|
|
|
752,891 |
|
|
|
670,105 |
|
|
Noncurrent assets |
|
|
|
|
|
|
|
|
|
|||
|
Property and equipment, net |
|
|
169,636 |
|
|
|
163,328 |
|
|
|
150,670 |
|
|
Goodwill and net intangibles |
|
|
221,331 |
|
|
|
211,738 |
|
|
|
218,864 |
|
|
Right of use leases – operating, net |
|
|
48,728 |
|
|
|
51,213 |
|
|
|
56,512 |
|
|
Deferred tax asset, net |
|
|
89,341 |
|
|
|
98,226 |
|
|
|
122,129 |
|
|
Other long-term assets |
|
|
10,184 |
|
|
|
10,281 |
|
|
|
8,801 |
|
|
Total noncurrent assets |
|
|
539,220 |
|
|
|
534,786 |
|
|
|
556,976 |
|
|
Total assets |
|
$ |
1,327,747 |
|
|
$ |
1,287,677 |
|
|
$ |
1,227,081 |
|
|
LIABILITIES AND STOCKHOLDERS’ EQUITY |
|
|
|
|
|
|
|
|
|
|||
|
Current liabilities |
|
|
|
|
|
|
|
|
|
|||
|
Accounts payable |
|
$ |
77,188 |
|
|
$ |
74,888 |
|
|
$ |
65,321 |
|
|
Accrued expenses |
|
|
37,755 |
|
|
|
35,232 |
|
|
|
48,556 |
|
|
Operating lease liabilities |
|
|
12,741 |
|
|
|
12,643 |
|
|
|
12,341 |
|
|
Contract liabilities |
|
|
14,484 |
|
|
|
11,144 |
|
|
|
6,911 |
|
|
Current portion of long-term debt and finance lease obligations |
|
|
6,043 |
|
|
|
6,170 |
|
|
|
5,938 |
|
|
Other current liabilities |
|
|
9,304 |
|
|
|
7,685 |
|
|
|
6,678 |
|
|
Total current liabilities |
|
|
157,515 |
|
|
|
147,762 |
|
|
|
145,745 |
|
|
Noncurrent liabilities |
|
|
|
|
|
|
|
|
|
|||
|
Long-term debt and finance lease obligations |
|
|
19,041 |
|
|
|
18,042 |
|
|
|
34,780 |
|
|
Operating lease liabilities |
|
|
36,729 |
|
|
|
39,349 |
|
|
|
45,634 |
|
|
Legal settlement accrual |
|
|
51,607 |
|
|
|
48,803 |
|
|
|
— |
|
|
Other long-term liabilities |
|
|
4,356 |
|
|
|
2,816 |
|
|
|
5,369 |
|
|
Total noncurrent liabilities |
|
|
111,733 |
|
|
|
109,010 |
|
|
|
85,783 |
|
|
Total liabilities |
|
|
269,248 |
|
|
|
256,772 |
|
|
|
231,528 |
|
|
Total stockholders’ equity |
|
|
1,058,499 |
|
|
|
1,030,905 |
|
|
|
995,553 |
|
|
Total liabilities and stockholders’ equity |
|
$ |
1,327,747 |
|
|
$ |
1,287,677 |
|
|
$ |
1,227,081 |
|
|
Innovex International, Inc. |
||||||||||||
|
Condensed Consolidated Statements of Cash Flows |
||||||||||||
|
(Unaudited) |
||||||||||||
|
|
||||||||||||
|
|
|
Three months ended |
|
|||||||||
|
(in thousands) |
|
June 30, |
|
March 31, |
|
June 30, |
||||||
|
Cash flows from operating activities |
|
|
|
|
|
|
|
|
|
|||
|
Net Income (loss) |
|
$ |
25,031 |
|
|
$ |
(16,671 |
) |
|
$ |
15,345 |
|
|
Adjustments to reconcile net income to net cash provided by operating activities |
|
|
25,211 |
|
|
|
73,676 |
|
|
|
29,375 |
|
|
Changes in operating assets and liabilities, net of amounts related to acquisitions |
|
|
(13,214 |
) |
|
|
(37,165 |
) |
|
|
14,490 |
|
|
Net cash provided by operating activities |
|
$ |
37,028 |
|
|
$ |
19,840 |
|
|
$ |
59,210 |
|
|
Cash flows used in investing activities |
|
|
|
|
|
|
|
|
|
|||
|
Payments on acquisitions, net of cash acquired |
|
|
(12,041 |
) |
|
|
— |
|
|
|
(63,256 |
) |
|
Capital expenditures |
|
|
(6,641 |
) |
|
|
(5,827 |
) |
|
|
(7,297 |
) |
|
Proceeds from sale of property and equipment |
|
|
5,462 |
|
|
|
202 |
|
|
|
7,681 |
|
|
Cash acquired in stock based business combination |
|
|
— |
|
|
|
— |
|
|
|
— |
|
|
Net cash used in investing activities |
|
$ |
(13,220 |
) |
|
$ |
(5,625 |
) |
|
$ |
(62,872 |
) |
|
Cash flows provided by financing activities |
|
|
|
|
|
|
|
|
|
|||
|
Net borrowings (repayments) on line of credit |
|
|
— |
|
|
|
— |
|
|
|
13,400 |
|
|
Net repayments on term loan |
|
|
— |
|
|
|
— |
|
|
|
— |
|
|
Payments on finance leases |
|
|
(1,999 |
) |
|
|
(2,070 |
) |
|
|
(1,869 |
) |
|
Dividend payment |
|
|
— |
|
|
|
— |
|
|
|
— |
|
|
Other financing |
|
|
(388 |
) |
|
|
(14,840 |
) |
|
|
(9,089 |
) |
|
Net cash provided by (used in) financing activities |
|
$ |
(2,387 |
) |
|
$ |
(16,910 |
) |
|
$ |
2,442 |
|
|
Effect of exchange rate changes on cash and cash equivalents |
|
|
(73 |
) |
|
|
(5 |
) |
|
|
1,885 |
|
|
Net change in cash and cash equivalents |
|
$ |
21,348 |
|
|
$ |
(2,700 |
) |
|
$ |
665 |
|
Non-GAAP Measures
Adjusted EBITDA and Adjusted EBITDA Margin
We define Adjusted EBITDA (a non-GAAP measure) as net income (loss) before interest (income) expense, income tax expense (benefit), net, depreciation and amortization, (gain) loss on sale of assets and other expense, net, further adjusted to exclude certain items which we believe are not reflective of our ongoing performance or which are non-cash in nature. Management uses Adjusted EBITDA to assess the profitability of our business operations and to compare our operating performance to our competitors without regard to the impact of financing methods and capital structure and excluding costs that management believes do not reflect our ongoing operating performance. We track Adjusted EBITDA on an absolute dollar basis and as a percentage of revenue, which we refer to as Adjusted EBITDA Margin.
Free Cash Flow
We also utilize Free Cash Flow (a non-GAAP measure) to evaluate the cash generated by our operations and results of operations. We define Free Cash Flow as net cash provided by operating activities less capital expenditures, as presented in our Consolidated Statements of Cash Flows. Management believes Free Cash Flow is useful because it demonstrates the cash that was available in the period that was in excess of our needs to fund our capital expenditures. We track Free Cash Flow both on an absolute dollar basis and as a percentage of revenue. Free Cash Flow does not represent our residual cash flow available for discretionary expenditures, as we have non-discretionary expenditures, including, but not limited to, any principal payments required under the terms of our credit facility, which are not deducted in calculating Free Cash Flow.
Return on Capital Employed (ROCE)
We utilize Return on Capital Employed (“ROCE”) (a non-GAAP measure) to assess the effectiveness of our capital allocation over time and to compare our capital efficiency to our competitors. We define ROCE as income from operations excluding acquisition and integration costs, litigation related expenses not reflective of our ongoing operating performance, and income tax expense (resulting in Adjusted Income from Operations, after tax) divided by average capital employed. Capital employed is defined as the combined values of debt and stockholders’ equity. We revised our definition of ROCE and Adjusted Income from Operations, after tax to exclude litigation related expenses not reflective of our ongoing operating performance, which for the twelve months ended June 30, 2026 is reflective of the costs related to the Impulse Litigation. In particular, we believe that the exclusion of the aforementioned litigation related expenses eliminated in calculating Adjusted Income from Operations, after tax and ROCE provides useful measures for period-to-period comparisons of our business. We did not revise prior years’ Adjusted Income from Operations, after tax or ROCE because there were no other charges similar in nature to these costs.
Adjusted EBITDA, Adjusted EBITDA Margin, Free Cash Flow and ROCE do not represent and should not be considered alternatives to, or more meaningful than, net income and net cash provided by operating activities, or any other measure of financial performance presented in accordance with GAAP as measures of our financial performance. Our computation of Adjusted EBITDA, Free Cash Flow and ROCE may differ from computations of similarly titled measures of other companies. For a reconciliation of these non-GAAP measures to the most directly comparable GAAP measure, see tables below.
Management has provided outlook regarding Adjusted EBITDA, which is a non-GAAP financial measure and excludes certain charges. A reconciliation of this non-GAAP financial measure to the corresponding GAAP financial measure has not been provided because guidance for the various reconciling items is not provided. The Company is unable to provide guidance for these reconciling items because they cannot determine their probable significance, as certain items are outside of the Company’s control and cannot be reasonably predicted since these items could vary significantly from period to period. Accordingly, reconciliations to the corresponding GAAP financial measures are not available without unreasonable effort.
|
Innovex International, Inc. |
||||||||||||
|
Reconciliation of Net Income (Loss) to Adjusted EBITDA |
||||||||||||
|
(Unaudited) |
||||||||||||
|
|
||||||||||||
|
|
|
Three months ended |
|
|||||||||
|
(in thousands) |
|
June 30, |
|
March 31, |
|
June 30, |
||||||
|
Revenue |
|
$ |
244,896 |
|
|
$ |
239,031 |
|
|
$ |
224,234 |
|
|
Net income (loss) |
|
|
25,031 |
|
|
|
(16,671 |
) |
|
|
15,345 |
|
|
Interest (income) expense, net |
|
|
(653 |
) |
|
|
(388 |
) |
|
|
551 |
|
|
Income tax expense |
|
|
10,376 |
|
|
|
(4,923 |
) |
|
|
6,891 |
|
|
Depreciation and amortization |
|
|
16,213 |
|
|
|
16,222 |
|
|
|
14,974 |
|
|
EBITDA |
|
$ |
50,967 |
|
|
$ |
(5,760 |
) |
|
$ |
37,761 |
|
|
Other non-operating expense (income), net (1) |
|
|
(972 |
) |
|
|
150 |
|
|
|
(92 |
) |
|
Gain on sale of assets, net |
|
|
(9,853 |
) |
|
|
(2,020 |
) |
|
|
(419 |
) |
|
Impairment of long-lived assets |
|
|
— |
|
|
|
— |
|
|
|
503 |
|
|
Acquisition and integration costs (2) |
|
|
1,613 |
|
|
|
1,588 |
|
|
|
5,131 |
|
|
Provision for legal settlement (3) |
|
|
2,804 |
|
|
|
48,803 |
|
|
|
— |
|
|
Legal defense costs (4) |
|
|
— |
|
|
|
2,430 |
|
|
|
— |
|
|
Transaction costs (5) |
|
|
47 |
|
|
|
1,128 |
|
|
|
— |
|
|
Stock based compensation |
|
|
3,391 |
|
|
|
2,967 |
|
|
|
3,758 |
|
|
Adjusted EBITDA |
|
$ |
47,997 |
|
|
$ |
49,286 |
|
|
$ |
46,642 |
|
|
Net income (loss) % revenue |
|
|
10 |
% |
|
|
(7 |
)% |
|
|
7 |
% |
|
Adjusted EBITDA Margin |
|
|
20 |
% |
|
|
21 |
% |
|
|
21 |
% |
|
(1) |
Primarily represents foreign currency exchange (gain) loss, (gain) loss on lease terminations, and other non-operating items. |
|
(2) |
Consists of legal, accounting, advisory fees, move, severance and other integration costs associated with acquisitions, primarily related to Dril-Quip, DWS, SCF, Citadel and DIS. These costs are one-time in nature and represent expenses that we do not view as normal operating expenses necessary to operate our business. |
|
(3) |
Includes monetary damages awarded by a jury and estimated future awards related to the Impulse Litigation, which is not reflective of our ongoing operating performance. |
|
(4) |
Reflects legal defense costs associated with the Impulse Litigation, which is not reflective of our ongoing operating performance. These costs are recorded in Selling, general and administrative expenses in our Condensed Consolidated Statements of Operations and Comprehensive Income. |
|
(5) |
Reflects transaction costs associated with the secondary offering. |
|
Innovex International, Inc. |
||||||||||||
|
Reconciliation of Income from Operations to ROCE |
||||||||||||
|
(Unaudited) |
||||||||||||
|
|
||||||||||||
|
|
|
Twelve Months Ended |
|
|||||||||
|
(in thousands) |
|
June 30, |
|
December 31, |
|
June 30, |
||||||
|
Income from operations |
|
$ |
100,030 |
|
|
$ |
132,625 |
|
|
$ |
58,239 |
|
|
Plus: Acquisition and integration costs |
|
|
11,300 |
|
|
|
17,518 |
|
|
|
37,523 |
|
|
Plus: Provision for legal settlement (1) |
|
|
51,607 |
|
|
|
— |
|
|
|
— |
|
|
Plus: Legal defense costs (1) |
|
|
2,430 |
|
|
|
— |
|
|
|
— |
|
|
Less: Income tax expense |
|
|
(37,186 |
) |
|
|
(45,231 |
) |
|
|
(6,536 |
) |
|
Adjusted income from operations, after tax |
|
$ |
128,181 |
|
|
$ |
104,912 |
|
|
$ |
89,226 |
|
|
Beginning debt |
|
|
40,718 |
|
|
|
35,368 |
|
|
|
24,752 |
|
|
Beginning equity |
|
|
995,553 |
|
|
|
958,156 |
|
|
|
352,497 |
|
|
Ending debt |
|
|
25,084 |
|
|
|
25,631 |
|
|
|
40,718 |
|
|
Ending equity |
|
|
1,058,499 |
|
|
|
1,057,699 |
|
|
|
995,553 |
|
|
Average capital employed |
|
$ |
1,059,927 |
|
|
$ |
1,038,427 |
|
|
$ |
706,760 |
|
|
ROCE |
|
|
12 |
% |
|
|
10 |
% |
|
|
13 |
% |
|
(1) |
As defined in our Reconciliation of Net Income (Loss) to Adjusted EBITDA above. |
|
Innovex International, Inc. |
||||||||||||
|
Reconciliation of Net Cash from Operations to Free Cash Flow |
||||||||||||
|
(Unaudited) |
||||||||||||
|
|
||||||||||||
|
|
|
Three months ended |
|
|||||||||
|
(in thousands) |
|
June 30, |
|
March 31, |
|
June 30, |
||||||
|
Net cash provided by operating activities |
|
$ |
37,028 |
|
|
$ |
19,840 |
|
|
$ |
59,210 |
|
|
Capital expenditures |
|
|
(6,641 |
) |
|
|
(5,827 |
) |
|
|
(7,297 |
) |
|
Free Cash Flow |
|
$ |
30,387 |
|
|
$ |
14,013 |
|
|
$ |
51,913 |
|
|
Innovex International, Inc. |
||||||||||||
|
Geographic Revenue Details |
||||||||||||
|
(Unaudited) |
||||||||||||
|
|
||||||||||||
|
|
|
Three months ended |
|
|||||||||
|
(in thousands) |
|
June 30, |
|
March 31, |
|
June 30, |
||||||
|
North America Onshore (“NAM”) |
|
|
|
|
|
|
|
|
|
|||
|
Products |
|
$ |
86,265 |
|
|
$ |
89,522 |
|
|
$ |
77,368 |
|
|
Services |
|
|
16,693 |
|
|
|
17,020 |
|
|
|
15,901 |
|
|
Rental |
|
|
28,477 |
|
|
|
30,164 |
|
|
|
26,698 |
|
|
Revenue – North America Onshore |
|
|
131,435 |
|
|
|
136,706 |
|
|
|
119,967 |
|
|
International & Offshore |
|
|
|
|
|
|
|
|
|
|||
|
Products |
|
|
81,114 |
|
|
|
73,373 |
|
|
|
72,081 |
|
|
Services |
|
|
15,012 |
|
|
|
14,121 |
|
|
|
14,881 |
|
|
Rental |
|
|
17,335 |
|
|
|
14,831 |
|
|
|
17,305 |
|
|
Revenue – International & Offshore |
|
|
113,461 |
|
|
|
102,325 |
|
|
|
104,267 |
|
|
Total Revenue |
|
$ |
244,896 |
|
|
$ |
239,031 |
|
|
$ |
224,234 |
|
View source version on businesswire.com: https://www.businesswire.com/news/home/20260803958068/en/
Media gallery


